


📈Golden Hour?

Alex is up this week with some encouraging news from the technical trading world.
Headlines, man.
Headlines can be a real bummer. The media learned a long time ago that fear, uncertainty, and doubt sell a lot more subscriptions than reporting on how things are gradually getting better through steady, incremental improvement. Even I got a little bored writing that sentence.
And that glass rectangle in our pockets only exacerbates things.
 | Video clips by quotes | fa7e4cfa | 紗")
It hasn’t helped that the stock market hasn’t exactly been a joyride over the past year, either. However, there may be signs of life.
Here’s an encouraging, if wonky, headline for you:
S&P 500 Index Forms “Golden Cross” Feb 3rd

That’s it, folks! Break out the bubbly! Mission accomplished. Commendations all around for… what, exactly?
The “Golden Cross” is a technical trading term for when the 50-day moving average crosses above the 200-day moving average on a stock, or, in this case, an index of stocks. Historically, it has meant that the bear market is over and the bull market is back.

Cool! I guess! Follow-up question: WTF is a moving average and why does it matter?
Fair.
We actually covered this topic about this time last year when the opposite happened (the 50-day moving average cross below the 200-day moving average), also known, quite theatrically, as the “Death Cross.”

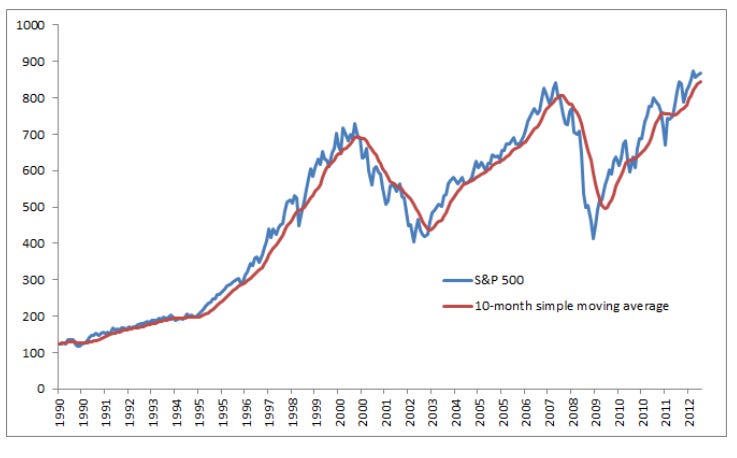
To summarize, a moving average is a statistical calculation that creates a series of averages from a subset of data over a specified period of time. You find the average of a specified number of data points over a given time period, and then slide the window of data points by one observation until the desired number of averages is obtained.
Practically, a moving average is useful for smoothing out short-term fluctuations and identifying long-term trends in stock prices.
It looks like this:
Neato.
So, why does it matter?
While technical trading hardly has the best reputation (some have characterized it as astrology for men, only instead of planets going into retrograde, you get to draw squiggly lines on graphs and use terms like “wedge down” or “triangle strong.” It’s mostly nonsense), this one signal has some salience, given its track record.
Basically, it’s rarely missed anticipating a bull market or recession. In other words, you could use this one signal to judge whether you should or shouldn’t be in the market. And people do. And it works… pretty good.1
Why? Because if you only owned the market after a Golden Cross and only got out after a Death Cross, you missed most of the recessions and stayed in for most of the bull market.

What’s the Upside?
The Golden Cross/Death Cross pattern is far from perfect. There are many times when a Death Cross forms and the market reverts back to a bull market. Meaning that if you choose to follow this strategy, you may find yourself selling out expecting the end times when, in reality, it was just a head fake. More importantly, there are tax implications for buying and selling stocks in one calendar year that can chew up any potential profits.2
All that said, starting 2023 with a Golden Cross forming is, literally, an encouraging sign. If I could have any other wish, it would be that the Golden Cross had formed closer to Easter so I could drench this post in Jesus’ Resurrection-themed memes.
Ah, well. You take what the market gives you, right?
For Your Weekend
Read

The Corrupt World Behind the Murdaughs by James Lasdun ($ The New Yorker)
The Murdaughs are everywhere right now: Netflix and HBO Max each have docuseries, and I wouldn’t be surprised if there are more out there. I watched the Netflix series (its only three 50ish minute episodes) and it was fine. It breaks no ground that the History Channel, the ID Network, or any other soapy true crime documentary hasn’t already tilled.
That said, the alluring part of true crime is that, even if the crime in question ultimately falls into a similar pattern (catalyst/crime/cover-up/more criming) every crime has its own contours that make it intriguing.
Watch the series on your subscription service of choice if you need something on while folding clothes or washing dishes. If you’d rather get the same story in <30 mins, read the article.
Watch

The Mandalorian (Disney+)
Mando and Grogu are back! After a long, COVID-interrupted hiatus, the adventure continues March 1. Even though he rarely takes off his helmet, its Pedro Pascal szn.
Chuckle

In fact, at least one fund company has raised over $2 billion running this exact strategy. And it can be part of your portfolio for the low, low cost of 0.60% per year, or $600 on $10,000 invested (not that cheap).
On a more technical basis, you will lag the market’s returns over time if you don’t also use leverage to catch back up. That’s another topic for another day, though.