📈Inflation is a Trip
When was your last road trip? Odds are, you plugged your destination into Apple or Google Maps (all hail our Silicon Valley overlords) and got a screen that showed a squiggly blue line showing you the way from A to B, along with an estimated drive time.
Those two pieces of information – path traveled and estimated time – are the focus of the discussion on inflation, which came in at 7.1% year-over-year, a forty-year high.
Naturally, the hot takes quickly flooded in: it was the greedy corporations, what about how it’s calculated, how could the Biden Administration do this to us, et cetera, et cetera, never mind all the “shadow" statistics folks on Twitter dot com who, because they “did their own research” believe inflation is actually 30% or more and only the blockchain/Bitcoin/DAOs can save us.
To put the 7.1% figure into context, we’re going to go back to high school physics.
Physics concerns itself with bodies in motion. At some point, you learned about rate of change. That’s the calculation – usually taught in physics – that tells you how one quantity changes relative to another quantity. So, that could be distance in time, mass by volume, applied force multiplied by time interval, etc.
Speed is probably the most common example. If you cover 80 miles in two hours, then your speed (rate of change) is 40 miles per hour. In this example, you’re looking at distance relative to speed.
When the headlines blare about the high inflation rate, all they’re doing is reporting the rate of change on the Consumer Price Index (CPI). CPI represents a basket of other, more specific indexes that, taken collectively, is meant to act as a barometer for the overall price level of goods and services in the United States.
The general price level of goods and services in CPI is like going from A to B on Google Maps. It tells you where you started and where you’re going.
Here’s the inflation level from 1948 through today:
The problem with this chart is that it only tells you what the inflation level is at any given time; it doesn’t tell you anything about the speed (rate of change) of inflation. Is inflation abiding traffic rules or speeding?
Think of that headline number like your speedometer. How fast is inflation moving, relative to the speed limit? In this case, the speed limit is around 2%, a defined by the Fed. So, if inflation is 7.1% when the speed limit is 2%, then we’re barreling down the road.
We can see those changes in inflation’s speed if we change the chart above into year-over-year change.
Looking at this chart, it’s like inflation stepped on the gas through the 70s and 80s, and then hit cruise control from the 1990s through the dip in 2008. Now, inflation has stepped on the gas.
As you can see, the rate of change chart tells us a lot more information than the pure A to B chart above. Yet they’re based on the same data series.
Getting to 7.1% isn’t hard. Take the current level – 280.192 – and divide it by the level from the year before – 261.560. (261.560/280.192)-1 = 7.1%.
We subjected you to this to throw some water on the concern that we’re hurtling towards 1980s-style hyperinflation. It’s possible but really unlikely. Like a car going from 0-60 requires less horsepower than accelerating from 60-120.
To wit:
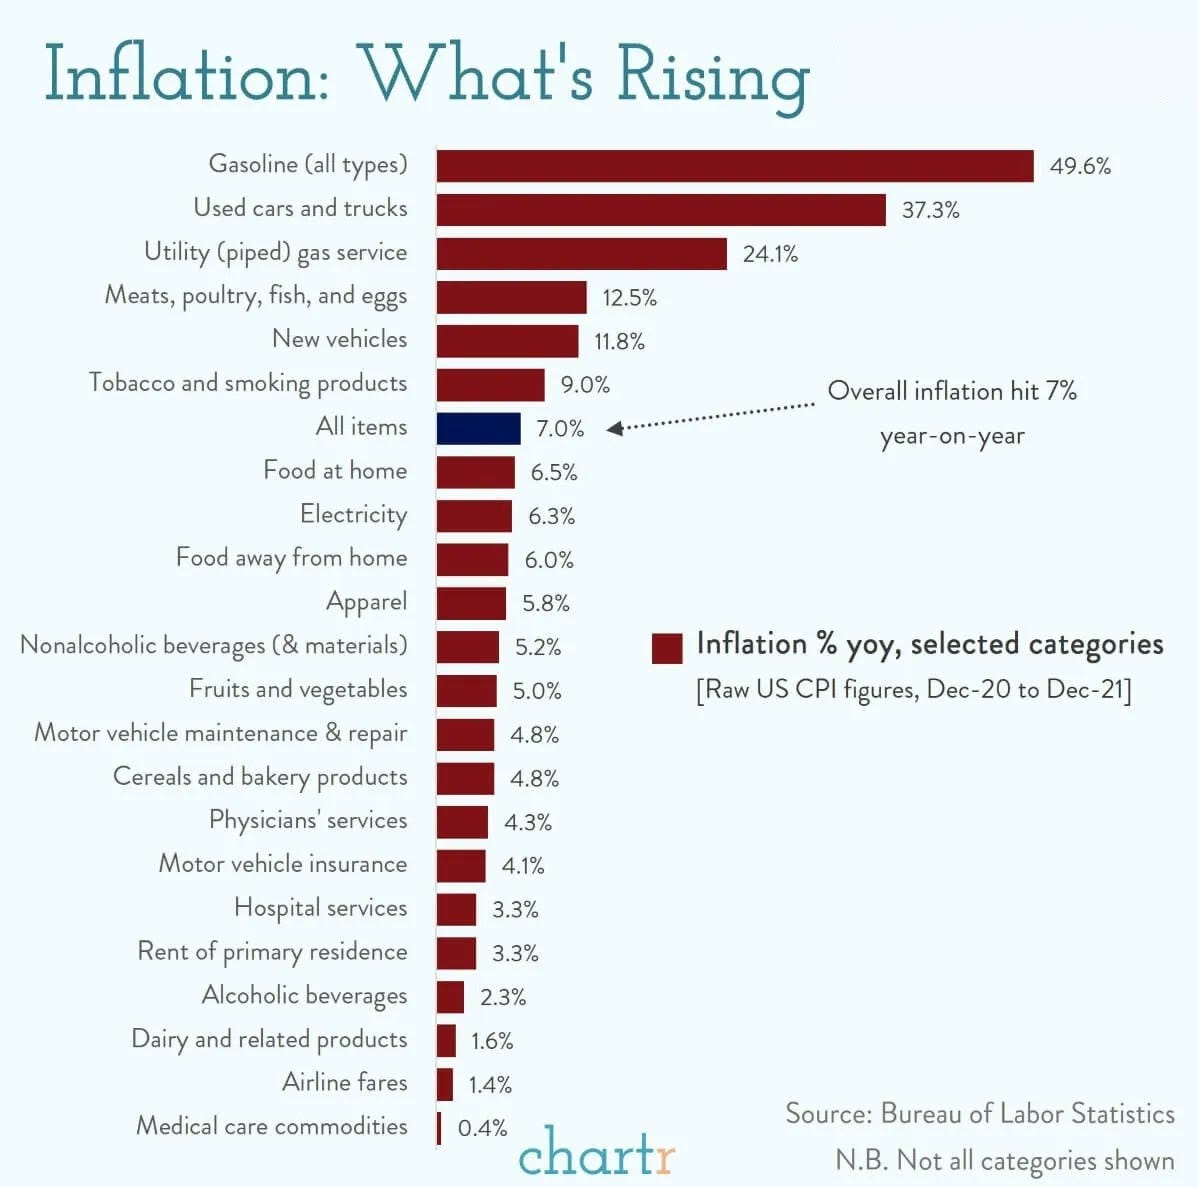
Inflation is similar. It takes more effort to push prices higher when prices are already accelerating at 7.1% year-over-year than it does when inflation is under 2% in 2020. And we can see why if we break down the components of inflation:
To this point, gasoline went from ~$1.94/gallon in April 2020 to ~$3.41/gallon last month. This was the largest move of any category of inflation. But since the price has already increased, another 50% move in the next year would make it $5.11/gallon which would be the highest on record ($4.11/gallon in 2008). So while this is possible it is unlikely because the faster inflation rises, the harder it is to maintain that pace.
What’s the Upside?
Albeit clumsily, this is what Jerome Powell meant when he characterized inflation as ‘transitory.’ The baseline CPI figure will, by default, be higher than it was during the 2020 pandemic/lockdown period; which means that CPI should show signs of slowing down.
Combine the higher comparison periods, the normalization of global supply chains, and less fiscal stimulus and it’s possible 7% is about as high as we see inflation get in 2022.
For Your Weekend
Our round-up of essays, podcasts, and streaming shows to check out over your weekend. We cast a wide net so you don’t have to.
Read:
The Betrayal by George Packer (The Atlantic)
At 20,000 words, George Packer’s feature in The Atlantic is one of the magazine’s longest-ever articles (and that’s saying something - the magazine has been continuously published since 1857) where he details the succession of failures, oversights, and disregard that led to the hasty withdrawal from Afghanistan last summer.
It’s a worthwhile read that takes an inside look at the people affected by decisions made in Washington and abroad.
Listen:
Jeff Shaw, Underground Cellar – Disrupting E-Commerce Wine Sales Through Gamification (The Meb Faber Show)
In today’s episode, we’re talking to one of the most passionate, gritty, and determined entrepreneurs around. Jeff begins by explaining where he got the idea to gamify the wine buying process. He shares how the company works – the process of buying the wine, the upgrade algorithm, and the logistics of storing the wine.
Then we hear how Mark Cuban turned him down multiple times, and leveraged that to get an investment from Shark Tank’s Barbara Corcoran. We talk about the experience of going through Y Combinator, raising money from Jason Calacanis, and what lies ahead for this fast growing startup.


